I can see where your coming from but I can't see the car actually getting to that point. If you imagine the lines falling down as they go past the most efficient point, they progressively make themselves worse.
---------- Post added at 09:13 PM ---------- Previous post was at 09:05 PM ----------
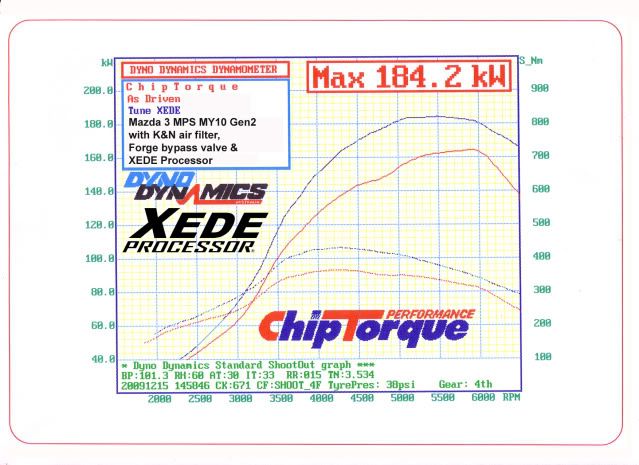
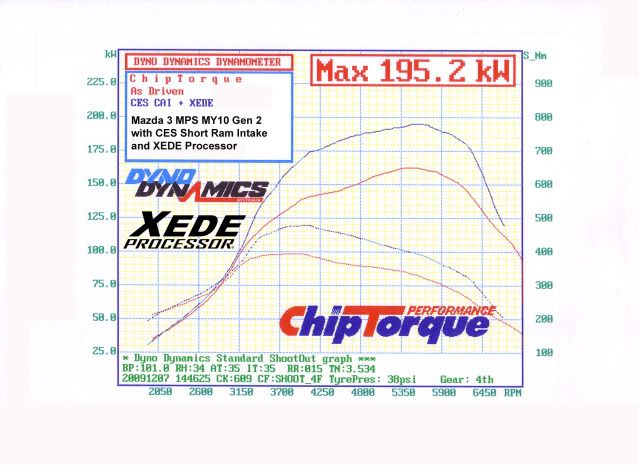
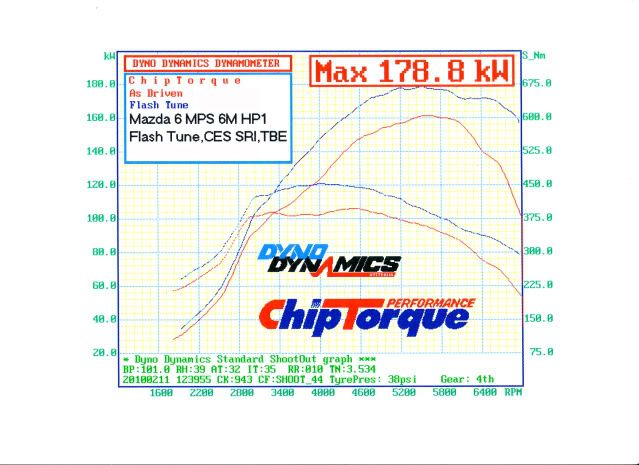
I would imagine the curves look more like this.

---------- Post added at 09:20 PM ---------- Previous post was at 09:13 PM ----------
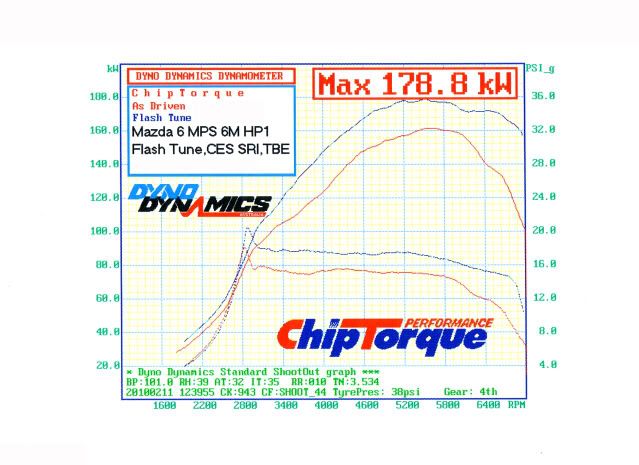
I cant explain it very well, sorry, but I will try to prove it. I'll wire my waste gate shut and film it and show you my car only pushing 14PSI above 5500 RPM. I'll just have to be careful lower in the revs.


Originally Posted by nissanman


 Reply With Quote
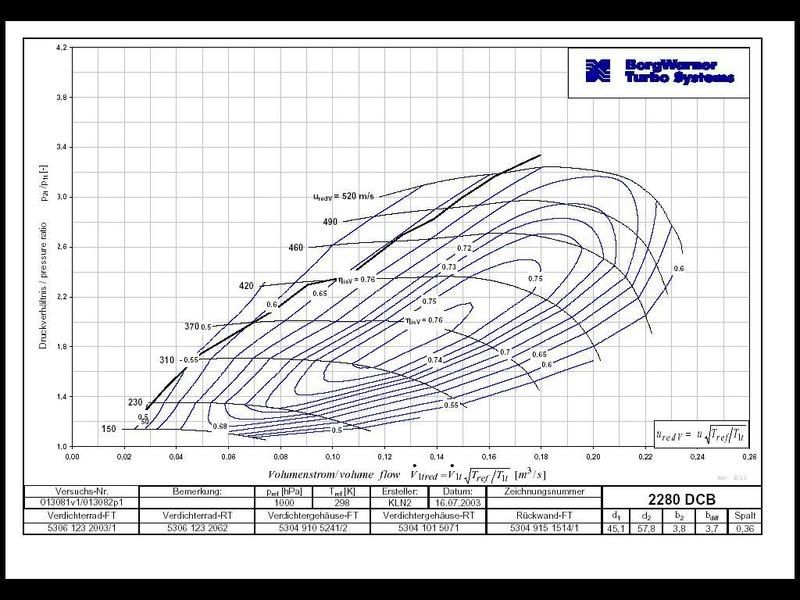


 cheers for that,